One key benefit of using a system like Waitlist Me is the increased customer satisfaction that comes with providing more accurate wait time quotes. It can be challenging for staff to estimate the wait times correctly, and it can be frustrating for customers when they are told wait times that don’t turn out to be correct. There are several ways Waitlist Me helps you make smarter wait estimates, and we have recently added new features to the browser version of the service that can be accessed by logging into our website.
Experience has shown that being able to see the actual waits next to the wait estimates helps people improve their wait estimates over time, as it provides a key feedback loop for knowing how accurate estimates are and when they need to be adjusted based on changes in traffic patterns.
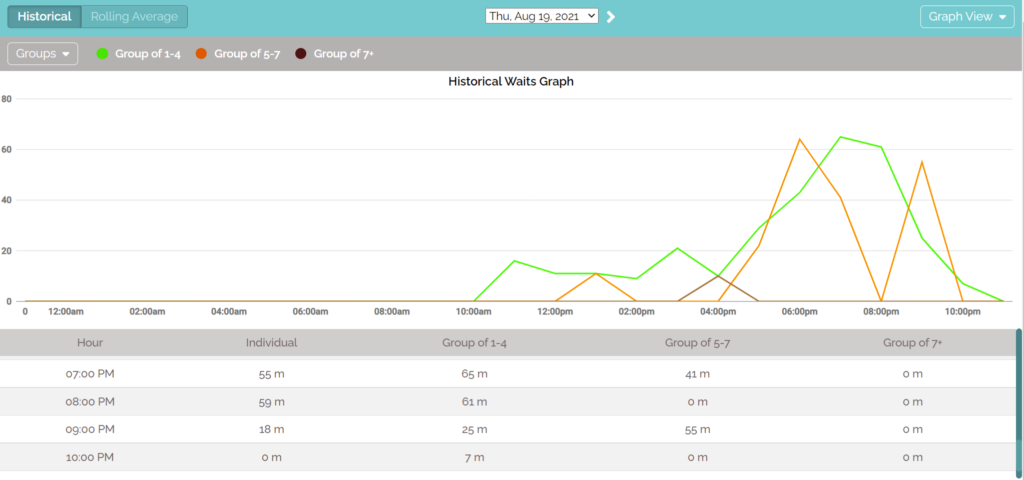
In addition, Waitlist Me has a couple ways for suggesting wait times based on rolling averages and historical wait times. The rolling average method recalculates estimates every time a party is marked as served and includes settings for how long of a time period to use and how to treat parties of different sizes. The historical wait method provides suggestions based on daily patterns by using past data for each hour and day of the week.
In addition to seeing real-time smart suggestions as customers are served, there are graphs that show this data over time and by party size. These graphs have been available in the tablet versions of the Waitlist Me apps and are now available in the browser version. Check out this article for more details on the smart wait estimates and graphs.
