One of the features included in the Pro subscription is a Stats page that gives an overview of the shift or day. Quickly see data for each server: how many groups they’ve had, how many total people were in those groups, their average party size, and the average time it took to turn tables.
You can choose what time frame you would like to see stats for. Pressing on Time in the header bar will let you select from these options:
– Current day – see all of today’s numbers
– Past hours – choose any increment up to 24 hours (for example, view the past 4 hours on a rolling basis)
– Shifts – enter in blocks of hours to coincide with your shifts (for example, 11:00 am to 4:00 pm and 4:00 pm to 11 pm)
Press on the Stats icon to go to the new analytics view. This page will display each section name, the server assigned, how many groups/people have been served, and averages for party size and time. Pressing on the headers at the top will sort by any of those categories. If you prefer to see things graphically, using the radio buttons at the bottom of each column will display that data in the chart below. You can also see all these metrics by table or assignment, by clicking on the Sections label at the top.
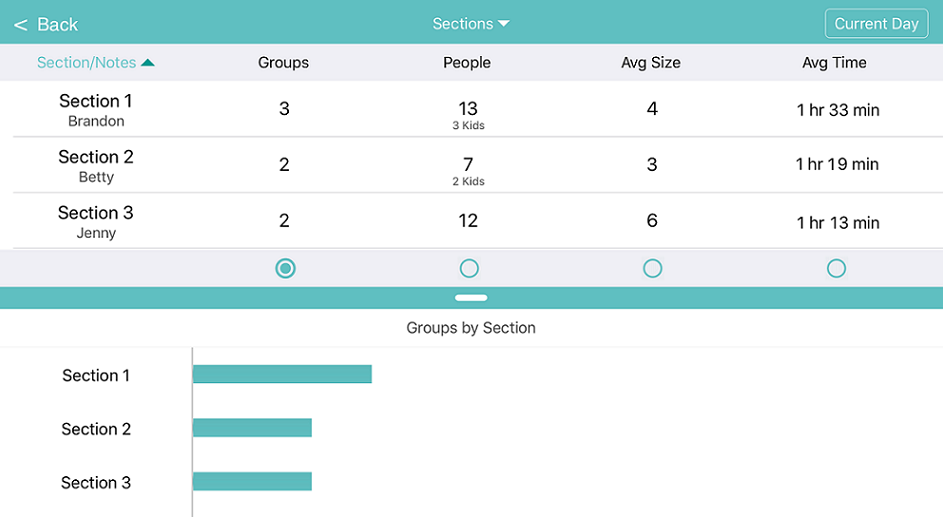
The data on the Stats page can help hosts know where to seat the next party, so that each server gets their fair share of the work (and the tips!)
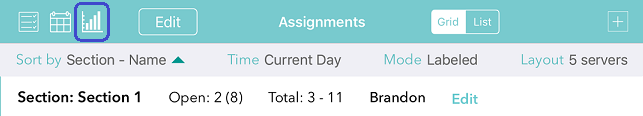
Before getting the most out of the new stats features, you’ll need to set up your tables and sections. Then you can choose a layout, select how you want to view the tables, and assign servers. Sort by Section and use the Labeled mode in order to add server’s names to sections. Use the Edit link in the header row of the first section to enter server names.